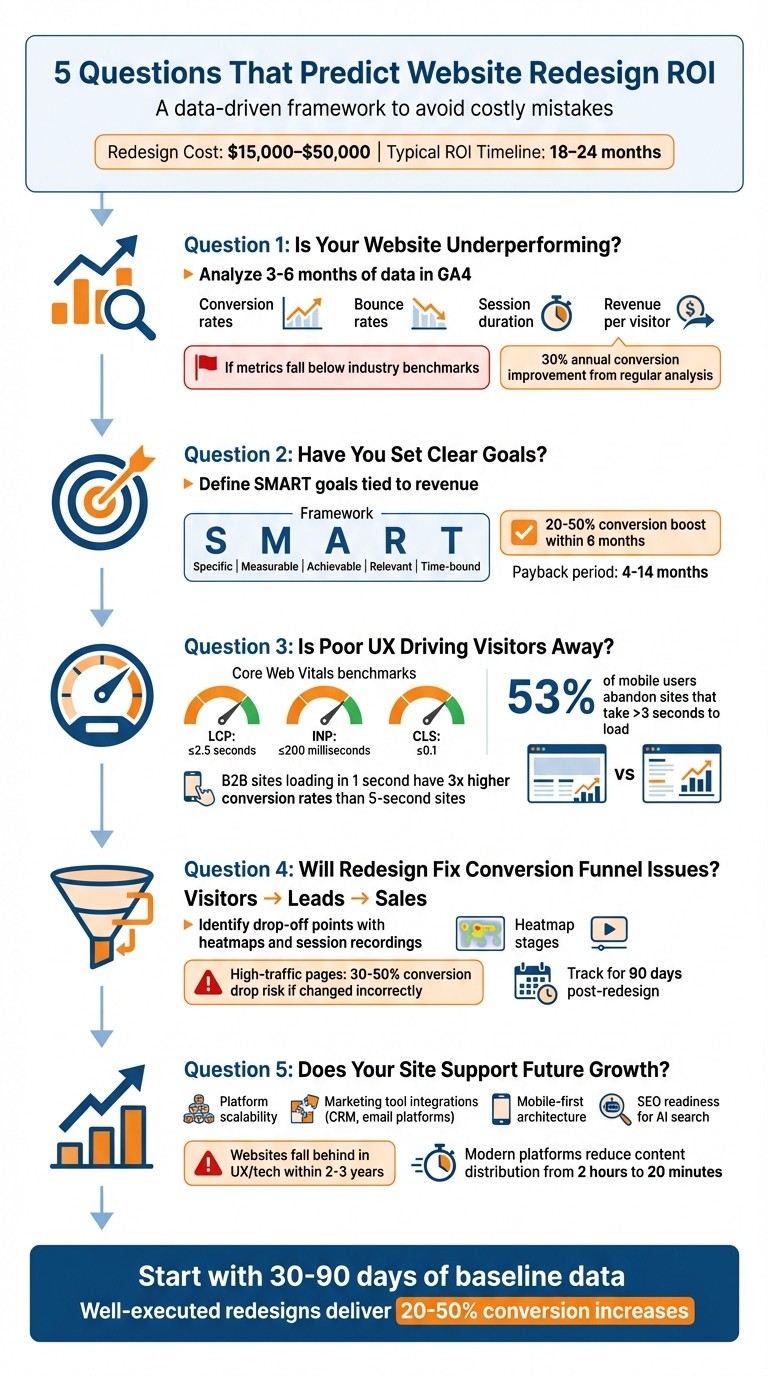
Is a website redesign worth it? Only if it delivers measurable results. Many businesses rush into redesigns based on opinions rather than data, resulting in wasted budgets and missed opportunities. A redesign can cost $15,000–$50,000 in 2026, with ROI often taking 18–24 months. To avoid costly mistakes, ask these five critical questions:
Is your website underperforming? Use tools like GA4 to track metrics such as conversion rates, bounce rates, and session durations. Focus on revenue-driving metrics, not vanity stats.
Do you have clear goals? Define SMART goals tied to revenue, like increasing demo requests or reducing cart abandonment.
Is poor user experience driving visitors away? Check Core Web Vitals (e.g., load time under 2.5 seconds) and optimize mobile performance.
Will a redesign fix conversion funnel issues? Audit each funnel stage, identify drop-offs, and focus on high-impact changes.
Does your site support future growth? Ensure your platform can handle scaling, integrations, and modern SEO requirements.
Key takeaway: Redesigns should solve specific problems and boost revenue. Start by analyzing performance, setting measurable goals, and planning for long-term scalability.
5 Questions to Determine if Your Website Redesign Will Pay Off
Question 1: Is Your Website Underperforming Based on Key Metrics?
You can’t fix what you don’t measure. Before jumping into a website redesign, take a step back and evaluate your site’s performance using tools like GA4 and Google Search Console. Focus on metrics like traffic trends, bounce rates, conversion rates, and session duration over the past 3 to 6 months. This timeframe helps you spot consistent patterns rather than reacting to short-term swings [8].
It’s also important to separate revenue-driving metrics from vanity metrics. Revenue metrics - such as conversion rates, lead quality, and revenue per visitor - directly affect your business growth. Vanity metrics, like total page views or unique visitors, might look good on paper but don’t always lead to tangible results [1][7]. For instance, if you attract 10,000 visitors per month but only convert 0.5%, you’re leaving money on the table. To calculate your "cost of inaction", use this formula:
(Industry conversion rate − Your conversion rate) × Monthly visitors × Average deal value.
How to Review Your Current Performance Data
Start by collecting 30 to 90 days of clean data before making any changes. This baseline will help you measure the impact of your redesign accurately [6][1]. In GA4, look at engagement metrics like average session duration, pages per session, and bounce rate. Break down traffic sources - organic, paid, social, and direct - to identify which channels bring engaged users and which ones don’t [6].
Don’t stop with GA4. Use tools like Google PageSpeed Insights to check if your page load times are under 2 seconds. Add heatmap tools, such as Hotjar or Crazy Egg, to see how visitors interact with your site. These tools can help you understand why bounce rates are high or where users lose interest [6][8]. Also, track your conversion funnel, monitoring both macro-conversions (e.g., purchases, form submissions) and micro-conversions (e.g., video plays, resource downloads) to pinpoint where users drop off [6].
Finally, compare your metrics against industry benchmarks to see how much potential revenue you might be losing due to underperformance.
Performance Benchmarks for Small Businesses
Here’s how your website should stack up against industry standards:
Metric | Content/Blog Sites | E-commerce Sites | B2B/Lead Gen Sites |
|---|---|---|---|
Average Session Duration | 2–3 minutes | 3–4 minutes | N/A |
Pages per Session | 2.5+ pages | 4.5+ pages | N/A |
Bounce Rate | Under 60% | Under 40% | N/A |
Conversion Rate | N/A | 1.8%–2.9% | 2%–5% |
Return Visitor Rate | 30%+ | 30%+ | 30%+ |
If your metrics fall below these benchmarks, it’s a clear sign your website isn’t performing at its best. Regularly analyzing traffic data can lead to conversion improvements of around 30% annually [6]. Plus, a well-planned redesign can lead to a 20% to 50% boost in conversions within six months [1].
One more thing: 61% of all website visits now happen on mobile devices [6]. If your mobile site isn’t up to par, that could be a major factor behind poor performance - sometimes even more than the need for a full redesign.
Question 2: Have You Set Clear Goals for Your Redesign?
Redesigning a website without clear goals can drain your budget and make it hard to measure success. As Jocelyn Lecamus, Co-Founder and CEO of Utsubo, explains, "CFOs and boards don't approve budgets because the design team is unhappy. They approve budgets when presented with revenue impact" [1]. This is why it's crucial to define success before making any changes.
Your goals should prioritize attracting visitors, converting leads, and boosting sales [10]. But redesigns can also aim for broader improvements, like enhancing customer service outreach, streamlining recruiting efforts, or enabling your marketing team to update the site without needing developer support [5][11].
The focus should always remain on revenue-driving metrics rather than vanity metrics. For instance, instead of simply aiming to increase traffic, set measurable targets. Many redesigns result in a 20–50% boost in conversions within six months, with payback periods ranging from 4 to 14 months [1]. However, this kind of success is only possible if you define your goals clearly from the start.
Next, let’s explore how to create SMART goals that tie your redesign directly to revenue outcomes.
How to Set SMART Goals for Your Website
Using the performance data you’ve gathered earlier, you can define goals that lead to measurable improvements. The SMART framework keeps your redesign focused and prevents it from veering off course. Each goal should be Specific, Measurable, Achievable, Relevant, and Time-bound [10].
For example, instead of vaguely aiming to "improve conversions", you could set a SMART goal like: "Increase lead form submissions within 90 days by simplifying the form and adding social proof." This provides a clear target, a timeline, and actionable steps.
Review your baseline data to estimate realistic improvements rather than guessing [1]. This data will also help you calculate the cost of inaction by identifying how much revenue is lost due to current performance gaps.
Examples of Measurable Redesign Goals
Once you define your SMART goals, use these examples to guide your redesign strategy:
Business Type | Primary Goal Example | Secondary Goal Example |
|---|---|---|
B2B SaaS | Increase demo requests within a defined period | Boost content downloads during a targeted campaign |
E-commerce | Improve revenue per visitor through higher conversions | Reduce cart abandonment by optimizing the checkout flow |
Professional Services | Increase consultation bookings over a set timeframe | Enhance lead quality through refined user targeting |
Technical goals are just as important. For instance, improving site performance by keeping page load times under three seconds can significantly reduce bounce rates and increase conversions [7]. Similarly, ensuring ADA compliance not only meets legal requirements but also broadens your audience. If your marketing team depends on developers for updates, set a goal to empower them with tools for independent updates [11].
To stay on track, create a "must-have" list early in the process. This list should include features that directly support your SMART objectives, helping you avoid last-minute requests that could derail your strategy [12].
Question 3: Is Poor User Experience Driving Visitors Away?
A poor user experience does more than just annoy visitors - it can directly hurt your bottom line. If your website is slow to load, shifts content unexpectedly, or doesn't work well on mobile devices, potential customers are likely to leave before completing a purchase. Consider this: B2B websites that load in 1 second have conversion rates 3 times higher than those that take 5 seconds [2]. On top of that, 53% of users abandon mobile sites if they take longer than three seconds to load [18].
Many businesses hesitate to invest in improving user experience because they struggle to connect these changes to revenue. As Bart Jarochowski, Martin Schierle, and Dikla Cohen from web.dev explain:
"Even though the case for speed is clear, many companies still struggle with prioritizing work that will improve their site speed since they do not know exactly how it affects their users and as a result their business" [14].
The numbers don’t lie. Swappie, a company specializing in refurbished phones, enhanced its mobile site's Largest Contentful Paint (LCP) by 55% and Cumulative Layout Shift (CLS) by 91%, which resulted in a 42% increase in mobile revenue [13]. Similarly, Vodafone improved its LCP by 31%, leading to an 8% boost in total sales [13].
Tools to Test and Improve User Experience
If you're unsure where to start, there are tools available to help you measure and address user experience issues. For example:
Google Search Console: Check the Core Web Vitals report under the "Experience" section to identify pages flagged as "Poor" or "Needs Improvement" [13].
Google PageSpeed Insights: Analyze specific URLs to get both lab diagnostics and real-world data [13].
Chrome DevTools: Use the Performance panel to monitor layout shifts and interactivity issues in real-time [16].
For accurate results, test in Incognito mode to avoid interference from browser cache or extensions [17][18]. When testing for mobile, use actual devices since mobile users often face delays due to slower networks and processing power [14].
You can also run A/B tests to see how speed improvements affect conversion and bounce rates [14]. And don’t forget to check Google Analytics Speed Reports to identify underperforming high-traffic pages [14].
User Experience Metrics to Monitor
To tackle user experience issues effectively, focus on Core Web Vitals. Pay attention to the 75th percentile of these metrics, as they highlight the most frustrating experiences for users [15]. A page is considered "Good" only if all three metrics meet the benchmarks at the 75th percentile [15].
Metric | What it Measures | "Good" Benchmark |
|---|---|---|
Largest Contentful Paint (LCP) | Loading performance (main content) | 2.5 seconds or less |
Interaction to Next Paint (INP) | Interactivity and responsiveness | 200 milliseconds or less |
Cumulative Layout Shift (CLS) | Visual stability (unexpected shifts) | 0.1 or less |
In addition to these technical metrics, track behavioral data like bounce rate and average session duration. A bounce rate over 55% might indicate the need for a redesign [9]. By analyzing how speed metrics correlate with user behavior, you can pinpoint exactly where poor user experience is causing visitors to leave [14]. Since mobile users are especially sensitive to delays, make sure to monitor mobile-specific data closely.
Question 4: Will a Redesign Fix Problems in Your Conversion Funnel?
A redesign won't solve your conversion funnel issues if it ignores where users are dropping off. With 75% of users judging a website's trustworthiness based on its design, poor performance in your funnel directly impacts revenue [6].
The first step is figuring out whether your funnel problems are caused by design flaws or something else. If you're seeing plenty of traffic but few conversions, focus your redesign on the stages where users abandon their journey. As Fio Dossetto, Former Senior Editor at Hotjar, explains:
"A website is a goldmine of insights - what people are looking for, where the flow gets stuck, what makes a prospective customer hesitate and drop off. If you don't leverage this information... something is going to go wrong." [20]
Breaking down each stage of your funnel helps you identify where design changes can make the biggest difference.
How to Review Each Stage of Your Funnel
Divide your funnel into three key stages: Visitors > Leads > Sales. Each stage requires specific attention. High-traffic pages with strong conversion rates are especially sensitive - major changes here can cause conversion rates to drop by 30–50% [21]. On the other hand, high-traffic pages with weak conversion rates often present the best opportunities for improvement. A detailed breakdown allows for precise, data-driven tweaks.
Use heatmaps and session recordings to uncover user frustrations, such as repeated clicks on non-functional elements or CTAs that aren’t immediately visible [19]. On pages with high drop-off rates, deploy exit surveys with a single, straightforward question like: "What is stopping you from [action] today?" This direct feedback can reveal obstacles that analytics alone might miss [19].
Also, segment your data by device and location. With most visits now coming from mobile devices [6], mobile-specific issues deserve extra attention. For example, a form that works fine on a desktop might have fields that are too small to tap on mobile, or a checkout process that requires excessive scrolling on smaller screens.
Tracking Conversion Improvements After Redesign
To measure the success of your redesign, you need consistent tracking before and after making changes.
Start by documenting your baseline performance for at least 30 days before the redesign [6]. Monitor both macro-conversions (like purchases or contact form submissions) and micro-conversions (such as newsletter signups or guide downloads) to understand how users move through your funnel [6]. According to research, marketers who regularly analyze traffic metrics see an average 30% boost in conversions annually [6].
Here’s an example of how to track changes across your funnel stages:
Metric | Pre-Redesign (Baseline) | Post-Redesign (Goal/Actual) | Change (%) |
|---|---|---|---|
Overall Conversion Rate | e.g., 2.1% | e.g., 3.5% | +66% |
Average Session Duration | 1:20 | 2:10 | +62% |
Form Abandonment Rate | 65% | 40% | -38% |
Mobile Conversion Rate | 1.2% | 2.8% | +133% |
A well-planned redesign can typically lead to a 20–50% lift in conversions within six months [1]. Use a 90-day cycle - 30 days for stabilization, 60 days for early signals, and 90 days for statistical significance - to calculate your ROI using the formula: (Net Gain ÷ Total Redesign Cost) × 100 [1][6][7].
Question 5: Does Your Current Website Support Future Business Growth?
Once you've tackled immediate performance and funnel issues, it’s time to think long-term. Is your website built to grow with your business? It might meet your needs today, but will it still perform 12 or 24 months down the line? Websites often fall behind in user experience (UX) and technology within 2–3 years [22]. If your platform struggles to keep up with plans like adding e-commerce, integrating marketing tools, or managing higher traffic, it may already be showing cracks.
The expense of a redesign isn’t just the upfront cost - it’s also the lost revenue when your marketing team waits weeks for a developer to launch a landing page or your site crashes during a high-traffic event. Jesse Schor, Head of Growth at Webstacks, sums it up well:
"The difference between websites that scale and websites that stall comes down to what happens before the project kicks off." [3]
Before diving into a redesign, assess whether your current platform can handle the tools, traffic, and functionality your business will need soon.
How to Check Your Website's Scalability and Integration Options
Start by looking at how long routine updates take. If creating a simple landing page requires developer involvement and weeks of waiting, your website’s architecture isn’t scalable [3]. Modern headless CMS platforms can automate tasks, cutting content distribution time across regions from two hours to just 20 minutes [4]. Long delays often signal underlying technical debt.
Next, review your current and planned marketing tools. Can your website connect seamlessly with your CRM (like Salesforce or HubSpot) or email platforms (like Klaviyo) using APIs or webhooks? [3] Manual data handling wastes time and increases error risks. Your platform should support real-time data flows for immediate actions (like form submissions) and event-driven integrations for tracking user behavior.
Scalability isn’t just about tools - it’s also about performance. Use Core Web Vitals as benchmarks: aim for a Largest Contentful Paint under 2.5 seconds and a Cumulative Layout Shift under 0.1. If your site can’t hit these targets, it may struggle with future traffic spikes.
Also, consider your platform’s architecture. Is it monolithic (where all components are tightly linked) or composable (where the backend and frontend are connected via APIs)? Monolithic platforms like traditional WordPress are easier to set up initially but can create “lock-in,” making upgrades difficult. Composable architectures, while requiring more advanced development practices, offer flexibility for long-term growth [3].
How Platform Migration Supports Growth
Switching to a modern platform can eliminate bottlenecks and reduce long-term costs. Kerri Frederick from Big Drop highlights the benefits:
"If making simple updates is a nightmare, if every change needs a developer... you're wasting time. A redesign can fix all that with a better structure [and] a CMS that works." [11]
Take Bicycle Playing Cards (Cartamundi) as an example. In 2023, they transformed their marketing site into a direct-to-consumer e-commerce platform with a scalable tech stack. Within five months, the new site outperformed the previous site’s entire annual sales volume [4]. Similarly, Patagonia saw mobile revenue grow by over 25% after revamping its e-commerce platform into a cohesive brand hub [4].
When evaluating platforms, focus on features that align with your growth strategy. Planning to expand into e-commerce? Platforms like BigCommerce are designed to handle growing product catalogs and checkout demands. Need more flexibility for your marketing team? A visual CMS with component-based design lets them build landing pages using pre-designed, brand-compliant blocks - no developer required [3].
Don’t forget maintenance costs. Older platforms that were simply “cloud-washed” (moved to the cloud without a true rebuild) often demand more resources to scale. In contrast, platforms like Framer are built with cloud-native architecture, reducing ongoing tasks like plugin updates and security patches [4].
Finally, think about SEO in an AI-driven search landscape. With AI Overviews in search results cutting organic click-through rates by up to 61% [1], your site needs a clean structure and proper schema markup to stay visible. Mobile-first design is now the default ranking system for search engines [22]. If your current platform can’t meet these evolving standards, it might be time to migrate.
Conclusion
Redesigning a website is more than just a facelift - it’s an investment in your business’s future. The five questions outlined here shift the conversation from subjective opinions like “the site looks outdated” to what truly matters: increasing revenue, improving conversion rates, and ensuring scalability.
Before diving into a redesign, it’s crucial to calculate the revenue you’re losing with your current site. If those losses outweigh the cost of a redesign, the decision becomes much easier. A well-executed redesign often results in a 20–50% boost in conversions within six months, with a typical payback period of 4–14 months [1].
Start by gathering 30–90 days of accurate data from tools like Google Analytics 4, Search Console, and your CRM. This data will help you establish benchmarks for conversion rates, traffic sources, and user engagement [1]. Not only does this justify your redesign investment, but it also serves as a roadmap for your strategy. Plus, having these metrics on hand allows you to measure the redesign’s success post-launch - essential for proving ROI and securing budget approval.
Striking Alchemy specializes in website audits to pinpoint where your site is falling short and how much it’s costing your business. Whether you need a platform migration to something modern like Framer, a more effective conversion funnel, or advanced tools like Klaviyo for email automation, we can create a custom plan tailored to your growth objectives. Get in touch for a free website audit and migration strategy to discover how a data-driven redesign can propel your business forward.
FAQs
How do I know if I need a redesign or just a few fixes?
Start by conducting a performance audit to identify potential issues like high bounce rates, slow page load times, or low conversion rates. If the problems are specific and limited in scope, you might be able to address them with targeted adjustments.
However, if your website suffers from broader issues - such as inconsistent branding, outdated technology, or a poor user experience - it may be time for a complete redesign. A full overhaul ensures your site not only reflects your current brand identity but also actively supports your business objectives.
What numbers should I track to prove redesign ROI?
To gauge the return on investment (ROI) of a website redesign, keep an eye on key metrics such as total sessions, bounce rate, session duration, pageviews per session, and goal completions. These metrics offer insights into traffic levels, user engagement, and whether the redesign is meeting its objectives. Pay close attention to how these numbers shift over time to determine if the redesign is delivering the desired results.
How long should I wait after launch to judge results?
It’s a good idea to hold off for about 2–3 months after launching your redesign before diving into a full evaluation of the results. This waiting period gives user behavior time to settle and ensures that performance metrics provide a clearer picture of any changes. During this time, keep an eye on key metrics like traffic, engagement, and conversions to gauge how your redesign is performing.